Optimizing Power Grids for Rural Rwanda
This is a summary of my 2017 degree dissertation, the full paper can be found here.
Background
Sub-Saharan Africa, broadly defined as the total area within and south of the Sahara Desert, has by far the lowest levels of electricity access of any region in the world.
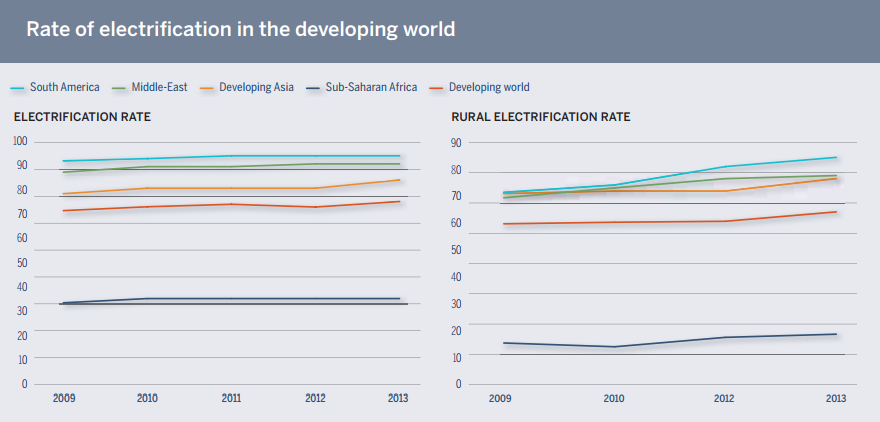
This problem is even more severe for rural communities that are outside the reach of national or international grid systems. There are many reasons for this particular inequality; politics, infrastructure, and geography all play a part. One factor unique to Sub-Saharan Africa, compared to other low-income region, is the incredibly low population density (~45 people per sq. km compared to ~375 for South Asia) source. Transporting energy costs money and with a sparse rural population it just isn’t cost effective to extend High Voltage power grids.
The geographic and social reasons for the state of Sub-Sahran Africa are vital to understanding and solving the shortage of electricity. However, the aim of this paper is only to explore engineering solutions, with the aim of decreasing the cost burden for governments and private investors in the African energy system. Areas with significant potential for improvement are energy efficiency, demand management, generation planning, and costing schemes. Specifically, this study will aim to optimize generation planning, and demand management for a variety of micro-grids and analyse any cost benefits. The main tool used is HOMER Pro 3.7, an energy grid simulator particularly suited to micro grids and renewable energy sources. In order to reduce scope, the study will focus on two villages in Rwanda; Rubagabaga and Rushunga.
The aims and objectives are:
- Serve village sized community with variable energy requirements
- Supply at least 600 people
- Supply enough power for conventional white goods (Refrigerator, freezer, etc.) defined as 2kWh/day/household
- Supply both residential and commercial loads with realistic load profiles
- Achieve a low cost that is in line with regional income.
- Net present cost (NPC) of less than $200,000 for whole system
- Levelised cost of energy (LCOE) of less than $0.3/kWh
- Achieve a stable supply with high efficiency and power quality
- Load connection at 230V 50Hz AC
- Load factor of over 40%
- Unmet load of less than 10%
- Analysis and selection of optimal storage solution
- Literature review of low cost energy storage solutions
- Optimization of storage technology in HOMER to determine size
- Analysis and selection of optimal control and dispatch methods
- Literature review of control methods
- Analyse qualities of grid for control selection
- Selection of low cost control method directly deployable within existing system structure
- Minimal carbon dioxide emissions
- Purely renewable energy sources
- Locally sourced materials where available
Existing Infrastructure
As part of the research for this project I assembled a list of known power generation sources in Rwanda and created a Google map displaying each and the major transmission lines connecting them. Each type of source has a different symbol, clicking on a source will show the type, the ownership, the output, grid connection, and completion date if it is under construction. The transmission lines are also distinguished by colour which can be seen by clicking a line.
This map shows that Rwanda is already relatively advanced in terms of energy diversification. There are a number of Mega Watt level solar farms in the east, peat power in the south, gas, biofuel, traditional thermal, many hydro plants, and even geothermal exploration in the north. Rwanda is blessed with hydropower potential due to the Nile and Congo river basins creating a flow of water north to south through the country. However the rainfall is highly variable so Rwanda cannot rely on hydropower alone.
Rwanda has a complicated political history and the economy remains based in agriculture with tea and coffee the largesty exports. Despite very real social and geographical hurdles, Rwanda currently has one of the fastest growing economies in the world and a relatively stable government. The costs of investment in the area remain high; connecting to the national grid costs a household $350 in Rwanda, whereas in Sudan it is $38 source.
Simulation
Before the simulation stage the technologies available to the region were identified and refined.
Grid Structure
A microgrid structure with distributed generation and storage was chosen as the most feasable option for grid layout. Microgrids can be designed as ‘islands’; totally self sustaining but with the ability to be connected to a wider national grid at a later date. The microgrids can then be used as stabilisers for the national grid as they can supply and store excess energy when needed. This acts as an incentive to governments to connect these rural communities to the wider grid system.
Load
Three bands of energy consumption were estimated from figures for national consumption and for common household devices. The peak power here is calculated for a population of 150 people (from Rubagabaga village).
| Band | Consumption per household (kWh/day) | Peak power (W) |
|---|---|---|
| Low | 0.5 | 76 |
| Medium | 1 | 152 |
| High | 2 | 304 |
The load profile describes how the load varies through the day and is measured by the ‘load factor’.
\[fLoad = AverageLoad / Maximum load\]A load factor of 1 is very steady and does not require extra storage. Given consumption information, HOMER generates load profiles for residential and commercial properties. From that simulation, our load factors are:
| Property | Load Factor |
|---|---|
| Residential | 0.264 |
| Commercial | 0.34 |
These show highly variable loads which means we will require sufficient energy storage.
Generation
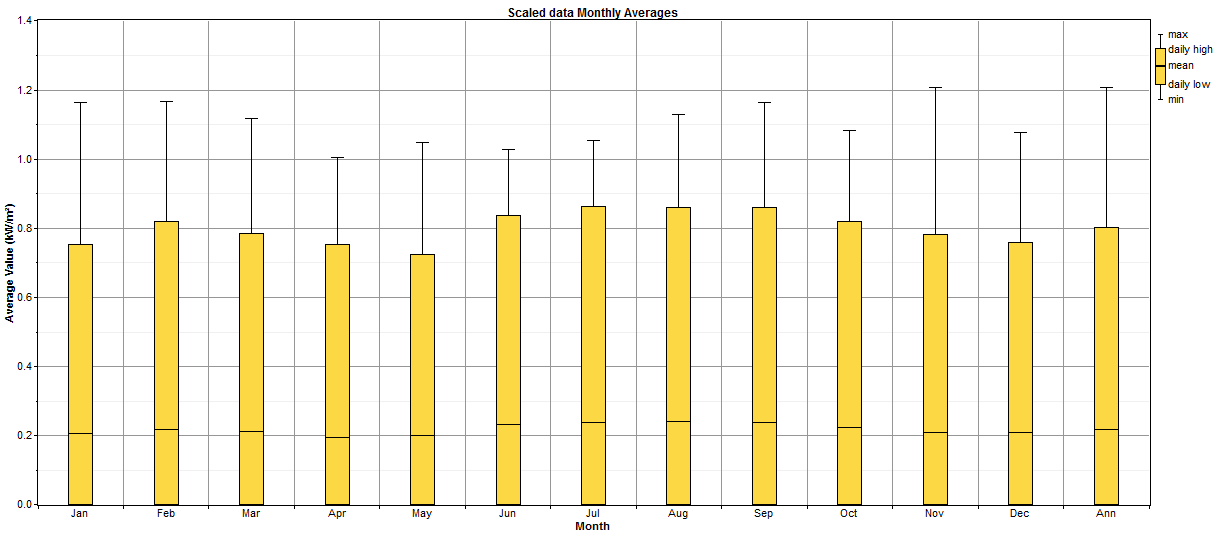
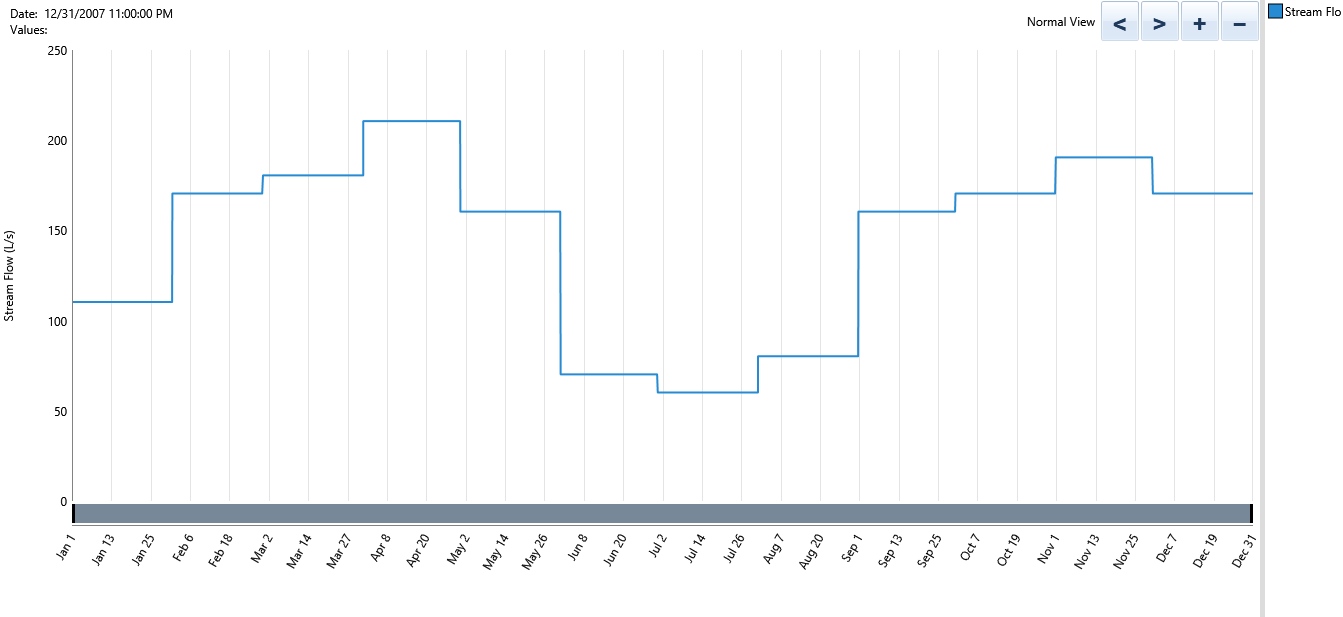
The most suitable generation methods identified for the region are Solar and Hydropower. Given geographic data inputs, HOMER can generate estimated monthly solar irradiation and river flow rates. Figures 3 and 4 suggest that a combination of solar and hydro may serve the village well as the solar can top up the hydro in the dry months of June and August.
Storage
Various storage options are assessed at this stage. While there are many exciting new clean storage technologies, currently the cheapest and most practicle are still conventional batteries. A Lithium Ion battery and a Lead Acid battery are both chosen for comparison in HOMER as well as a pumped hydro storage option, with a much higher capital cost but longer lifetime.
Control
A key aspect of a smart grid is an intelligent control system. Modern control algorithms can massively increase efficiency by optimizing power generation, transfer, storage, and consumption. The following control methods are deployed to the microgrid; frequency droop control, load following, cycle charging, reversed droop control, maximum power point tracking, and prime mover speed control.
Results
Hydro based microgrid
| Band | Optimal storage | Net Present Cost ($) | Annualised cost per person ($/year) | Excess Energy(%) | Unmet Load (%) |
|---|---|---|---|---|---|
| Low | None | 152,632 | 19.04 | 61.7 | 5.9 |
| Medium | Li-Ion | 172,622 | 21.48 | 46 | 7.4 |
| High | PHES | 1,581,945 | 196.70 | 11.9 | 8.6 |
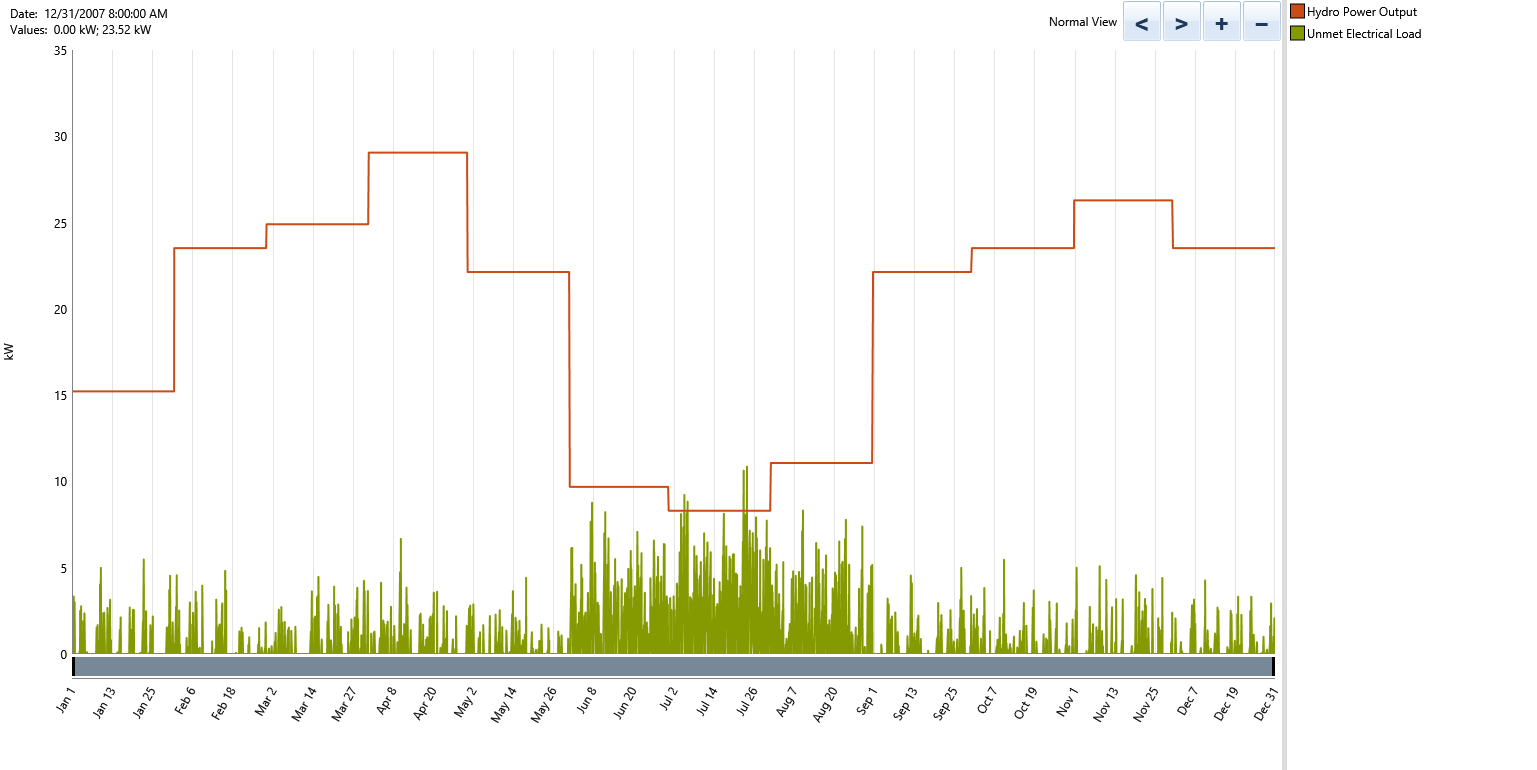
Here we can see the high cost of Pulsed Hydro Energy Storage (PHES) and the relatively low ongoing costs associated with micro-hydro. The excess energy for this grid is extremely high for the low band which suggests hydro always over-produces, this may not be a problem if the capital cost is low enough. This grid still suffers from the problem of the dry season in Rwanda. Figure 5 shows the monthly hydro output overlaid with daily unmet load (in green), we can see that June, July, and August have significant periods of unmet load which could be highly disruptive to the community.
Solar based microgrid
| Band | Optimal storage | Net Present Cost ($) | Annualised cost per person ($/year) | Excess Energy(%) | Unmet Load (%) |
|---|---|---|---|---|---|
| Low | Li-Ion | 201,945 | 25.11 | 31.8 | 8.1 |
| Medium | Li-Ion | 283,131 | 35.20 | 23.2 | 8.2 |
| High | Li-Ion | 452,058 | 56.21 | 23.6 | 7.9 |
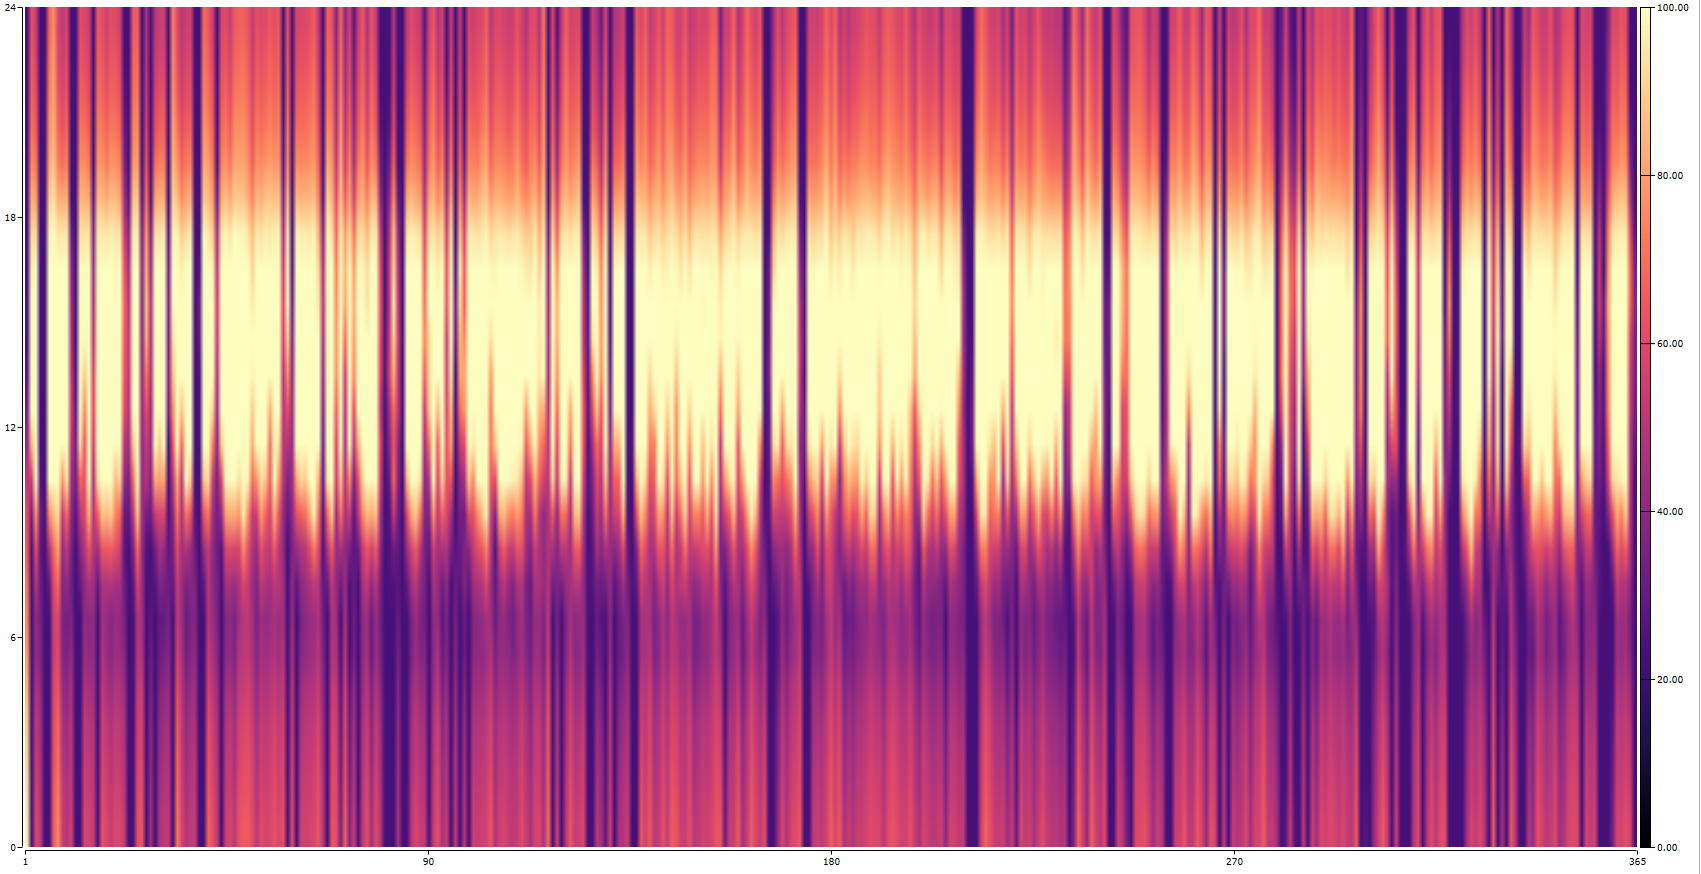
This grid type has middling costs but some key inneficiencies, namely a high percentage of excess energy in the afternoons. Figure 6 shows the battery charge state for the low band on this grid over 1 year. Dark areas are where there is low charge and light is high, it is clear that the afternoon on most days sees the batteries at full charge and excess energy is wasted. There are also numerous days where the batteries see no charge on cloudy days for example.
Summary
The microgrids created generally meet the requirements of objectives 1, 2, 3, & 6. 600 people can be served with 2kWh/day/household, however it is noted that serving this load from renewable energy sources requires a large initial capital investment. It was found that the microgrids are most suited to loads with consumption levels between 50 and 150kWh/day and that do not feature essential services. The net present cost (NPC) target of $200,000 was met for all levels of the hydro microgrid but only the low band solar grid meets the target.
Comparison between the solar and hydro based microgrids confirm that, for low and medium bands, hydropower has a much lower NPC and cost of energy (COE) than solar. The hydro turbine also has a much higher capacity factor than the solar panels meaning it provides enhanced economic efficiency which is attractive to investors. The major barriers to hydropower deployment are access and, in this case, yearly rainfall fluctuations. While access to hydropower in Rwanda may be high, the dry summer season reduces output by up to three quarters which can seriously affect the viability of the resource. The solar panels however were very consistent and offer a flexible low maintenance energy solution that can be used by any rural community in Sub-Saharan Africa.